Upgrading your ordinary STEM activities to a higher level
Gaining serious skills from STEM requires more analytical STEM activities
What do you really want to achieve through STEM activities with your kid? At one point you must honestly answer this question to avoid disappointment and confusion with the outcomes. The answer can have a wide range of possibilities, from just having a fun time with no particular long-term improvement in the kid’s knowledge to boosting the kid’s STEM abilities and educational performance.
If you browse the vast sea of STEM content available on the Internet, you will notice that STEM is actually a very broad term covering a wide range of topics and activities. The dominant discourse is that STEM activities will boost your kid’s educational performance. But this is not how the brain works, except in the very beginning, when kids need to find STEM stuff interesting in the first place.
At this initial level you are on a “fishing expedition”, searching for the specific topics or type of activities that your kid reacts to with interest. This is especially true for very young kids who are too young for anything more than this level. When you identify such a STEM topic, engage the kid in more activities of this type to boost the expectations and broaden the kid’s familiarity with the topic’s content and terminology.
However, the work gets more challenging if you want to guide your kid toward procedural knowledge. This is a stage where one can apply the acquired knowledge in practice to create something. In STEM, this level requires analytical skills, which in turn means more tedious STEM activities. But if your kid is truly enchanted by the STEM activities, then collecting and analyzing data is going to be fun.
In this episode I am describing a simple, but truly scientific STEM experiment. It is often performed in schools, but nevertheless, repeating it at home is highly advisable because you can play with changing details of the experiment and observing the outcomes.
The experiment is a simple mixing of vinegar (i.e., a dilute solution of acetic acid in water) and baking soda (bicarbonate of soda, sodium bicarbonate). We have already covered the chemistry of this reaction in our older episode where we measured the weight of released carbon dioxide gas. Please, read that episode first to familiarize yourself with the chemical reaction and with the safety measures.
Now we focus our attention on the endothermic nature of this reaction. This means the liquid gets colder thanks to the reaction between soda and acetic acid. The goal is to measure the change in temperature over time to learn something about the way chemical reactions work.
The experimental setup includes:
Baking soda and vinegar
A digital scale (with at least 1 gram precision)
A (glass) jar
A measuring cylinder or jug
A thermometer (e.g., a digital meat thermometer)
A camera (it can be your smartphone)
The experiment is simple:
Measure 20 mL of vinegar and pour it into the jar
Position the thermometer such that its tip is in the vinegar
Measure 20 g of baking soda
Start video recording the thermometer and then pour the soda into the jar
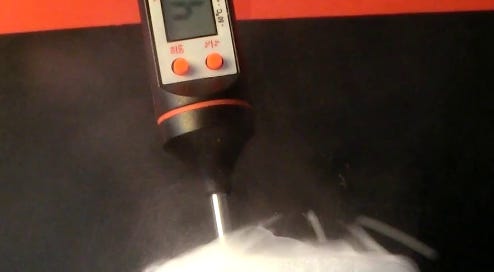
The temperature will quickly start to drop, but how much will go down and for how long are the open questions that you will explore. Keep recording it until the temperature stabilizes at its lowest value. After that replay the video and write down the time (seconds) whenever the temperature changes on the thermometer. The starting time zero is the moment when you poured all the soda into the vinegar.

Repeat this experiment with at least two additional changes:
Warm up the vinegar to about 40 °C
Cool the vinegar in freezer to about 0 °C
In both cases you will immediately notice a difference compared to the first attempt: the warm vinegar leads to a more furious reaction (it might bubble out of the jar), while the cold vinegar displays a calmer reaction.
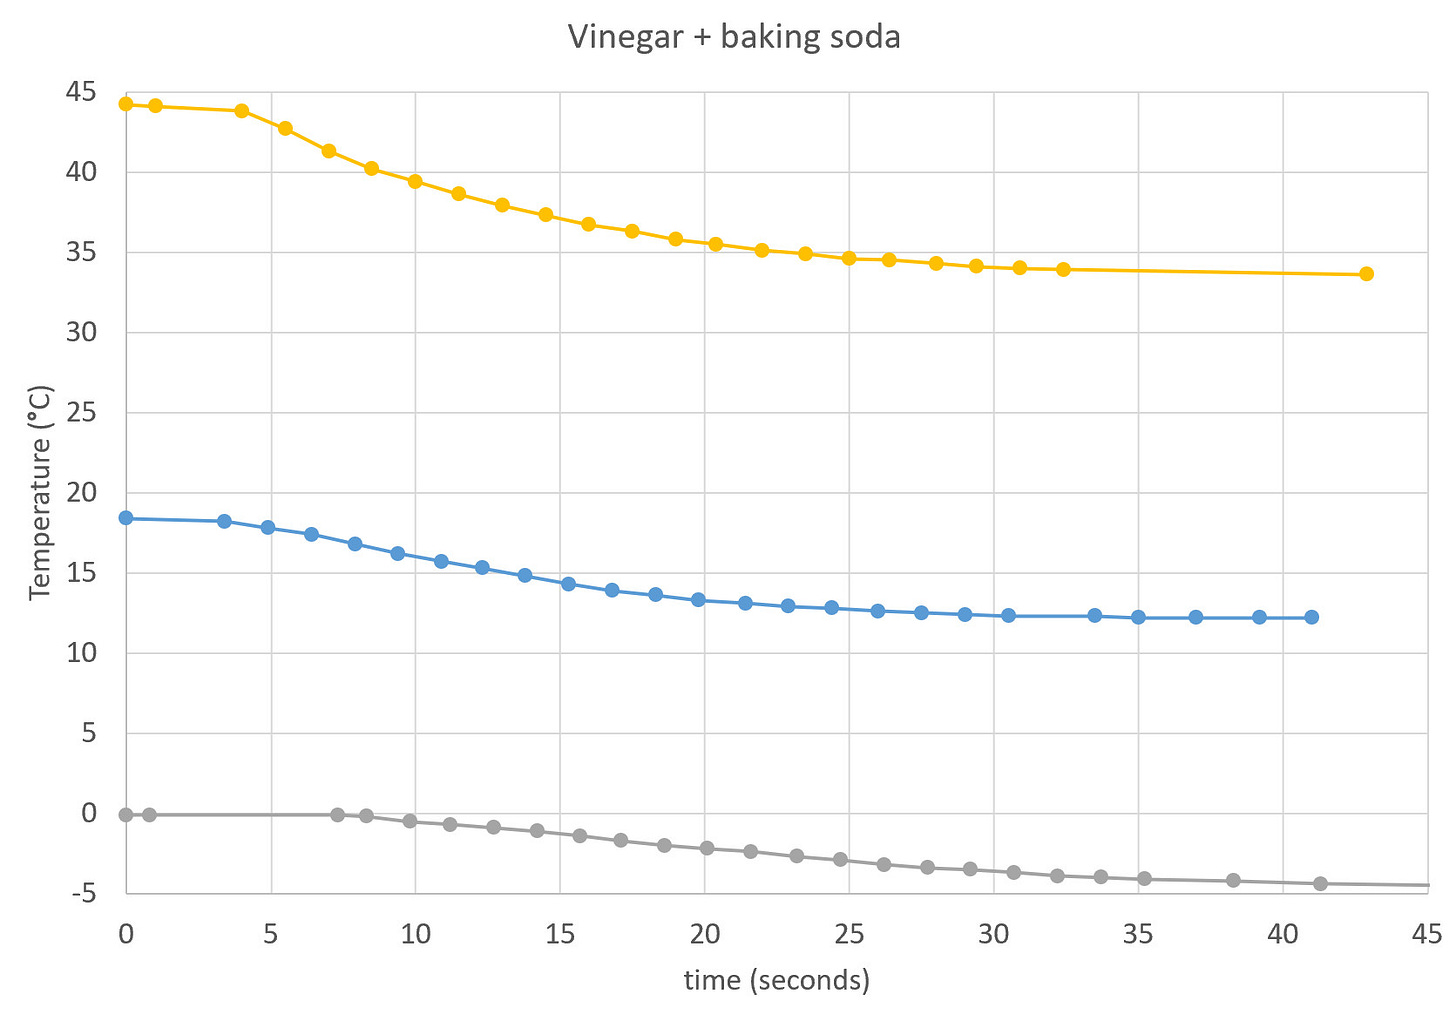
Once you have collected all the measurements, it is time for plotting graphs. Draw all of them together on one graph showing temperature versus time. Even better is to plot the drop in temperature relative to the initial temperature. In this case all experiments start at zero drop at zero seconds, and plotted lines clearly show the relative differences between experiments.
Recall that temperature is a measure of the speed of molecules. Therefore, temperature makes such a difference because the molecules of acid and soda are more probable to enter their chemical transformation if they collide with a higher speed, which means more energetic collisions, which in turn means higher temperature. When it is cold, the collisional speed (and energy) is lower, which means the probability is also lower. Chemical reactions of lower probability take many more collisional attempts, hence longer time, for molecules to enter their chemical transformation.
You can explore the reaction further by changing the volume of vinegar or the mass of soda, but keep the initial temperature the same. The trick is to vary only one variable to see how it affects the reaction. This is a typical approach in analytical thinking while investigating a phenomenon.


We should organize society, our public school systems and job training programs, around the concept of collective ownership instead of private businesses.
REMOVE MONEY, REMOVE CORRUPTION
If every worker got in exchange for their professional careers everything that they needed to have a happy, balanced life in a safe and healthy world governed by fair laws and modern practices, then our use of science and ethics to generate daily goods and services, as basic human entitlements, will have fulfilled the purpose of socialism: to ensure “universal protections for all by all” without using money anymore or national currencies to uphold private capital, maintain structural wealth, or support banks and financing and other profit-making activities.
#ScientificSocialism